#r# .. note::
#r# You can see the source by clicking on the eye
# A source code comment
##
###
#?# A comment that must not appear in the documentation
foo = 1
#r# ==========================
#r# A Restructuredtext Title
#r# ==========================
foo = 1
#r#
#r# Some reStructuredText contents
#r#
#m#
#m# Some Markdown contents
#m#
#m# [An inline-style link](https://www.python.org)
#m#
foo = 1
# Insert the output of the following python code
print(foo)
#o#
foo = 1
# Hidden Python code
#h# value = 123 * 3
foo = 1
#r# Format RST content with current locals dictionary using @@<<@@...@@>>@@ instead of {...}.
#r#
#r# .. math::
#r#
#r# I_d = @<@value@>@ I_s \left( e^{\frac{V_d}{n V_T}} - 1 \right)
#m# Format Markdown content with current locals dictionary using @@<<@@...@@>>@@ instead of {...}.
#m#
#m# $$I_d = @<@value@>@ I_s \left( e^{\frac{V_d}{n V_T}} - 1 \right)$$
# Add Python code as a literal block
#l# for x in ():
#l# 1 / 0 / 0
# Interactive code
#<i#
1 + 1
2 * 4 * 2
a, b = 1, 2
1, 2, 3
#i>#
# Guarded error
#<e#
1/0
#e>#
# Add a Python file as a literal block
#f# getthecode('RingModulator.py')
# Add the file content as literal block
#f# literal_include('kicad-pyspice-example.cir')
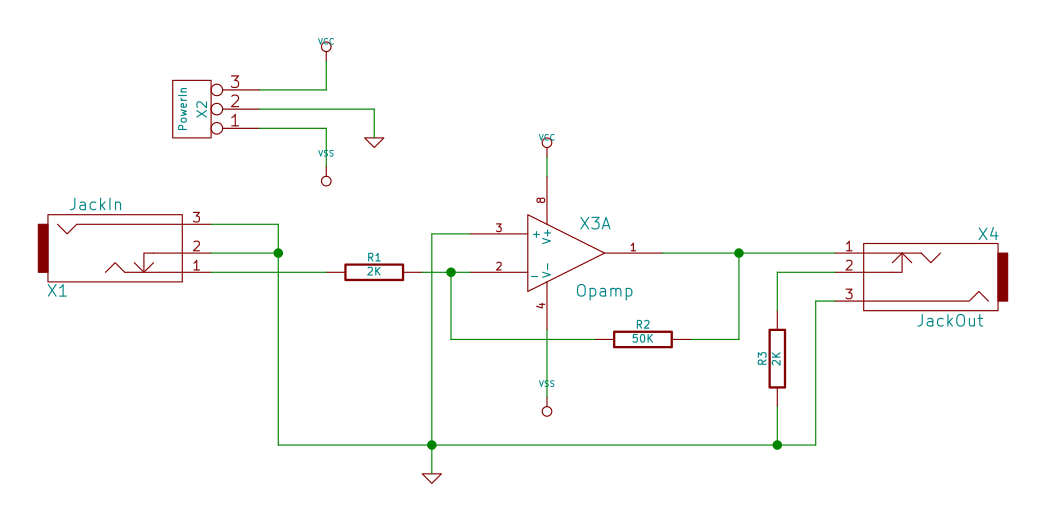
# Insert an image
#f# image('kicad-pyspice-example.sch.svg')
# Insert Circuit_macros diagram
#f# _ = circuit_macros
#f# _('circuit.m4')
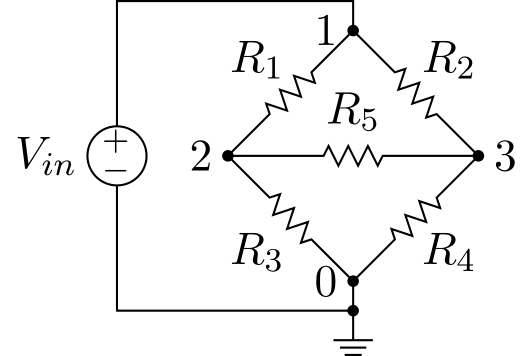
# Insert Tikz figure
# An image node accept theses reST image parameters: align, scale, height, width
#f# width = 3 * 200
#f# tikz('diode.tex',
#f# width=width)
# Insert a generated figure
#f# generated_figure('my-generator', 'generated_figure1.png', arg1='value1')
import numpy as np
import matplotlib.pyplot as plt
figure = plt.figure(1, (20, 10))
x = np.arange(1, 10, .1)
y = np.sin(x)
plt.plot(x, y)
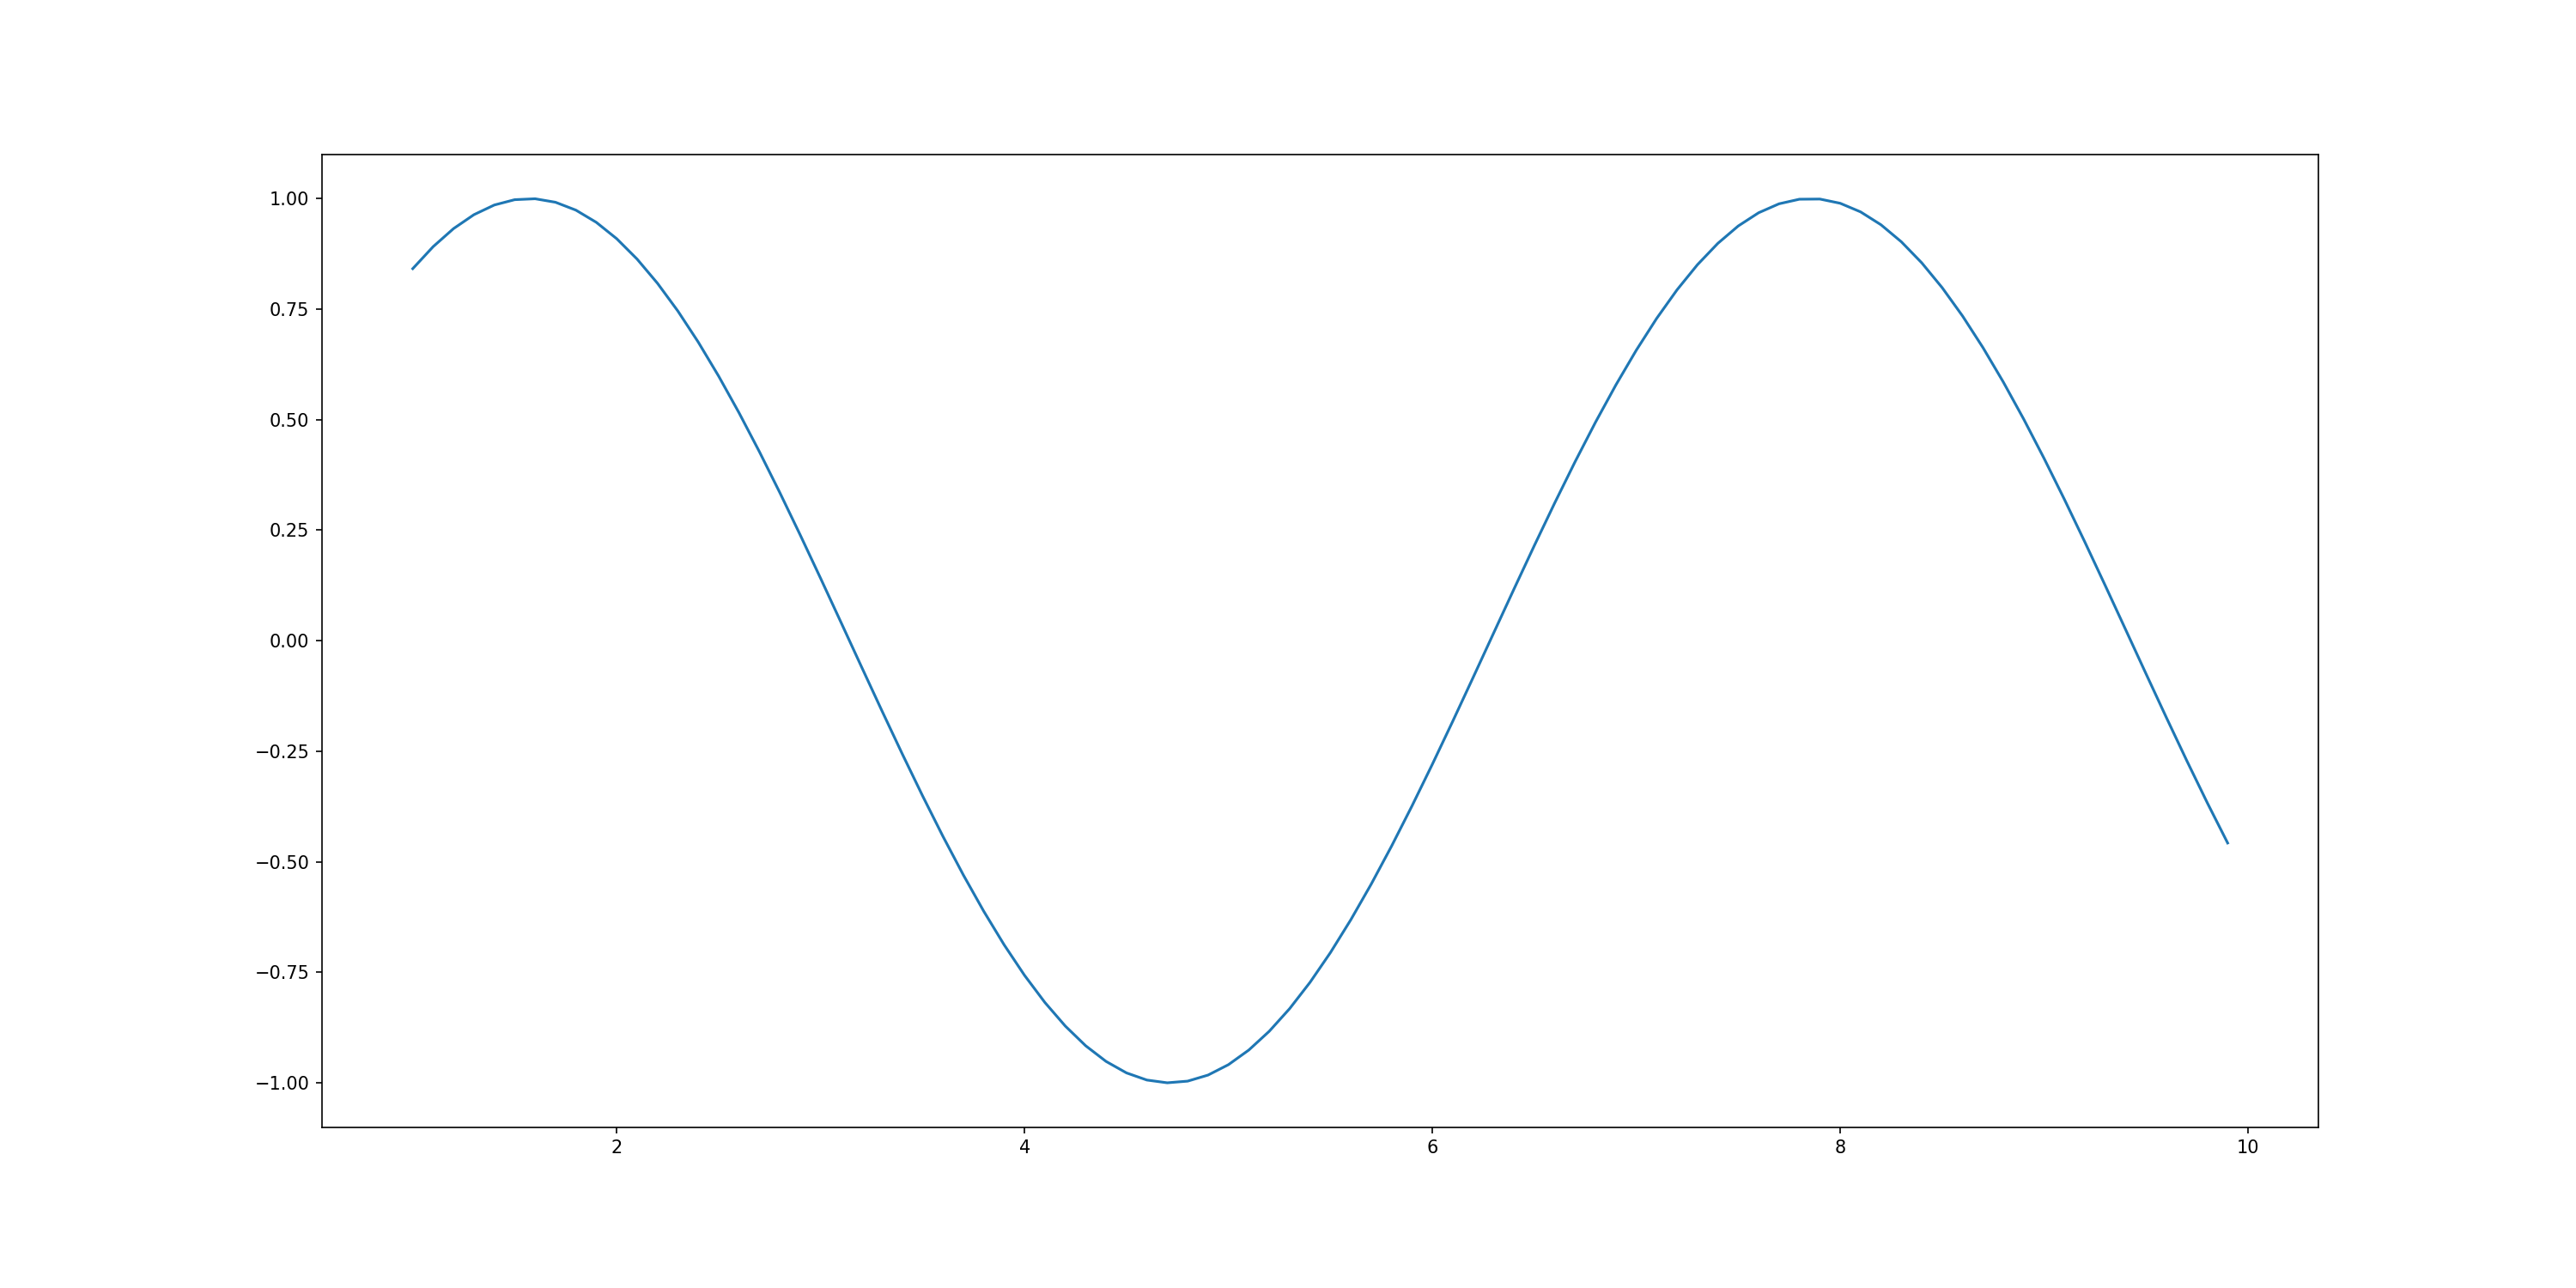
# Insert a Matplotlib figure
#f# save_figure('figure', 'my-figure.png',
#f# width=1280)
#f#
# Insert a table
N = 2
x = np.arange(-N, N, 0.5)
y = np.arange(-N, N, 0.5)
xx, yy = np.meshgrid(x, y, sparse=True)
z = np.sin(xx**2 + yy**2) / (xx**2 + yy**2 + .1)
#f# export('z', grid_size='x.shape[0]')
#f# table(z, str_format='{:.1f}')
#f# table('z', columns=[chr(ord('A') + i) for i in range(grid_size)], str_format='{:.3f}')
foo = 1
Note
You can see the source by clicking on the eye
# A source code comment
##
###

foo = 1
6.1.1.1. A Restructuredtext Title
foo = 1
Some reStructuredText contents
Some Markdown contents
foo = 1

# Insert the output of the following python code
print(foo)
1
foo = 1

# Hidden Python code
foo = 1
Format RST content with current locals dictionary using @<@…@>@ instead of {…}.
Format Markdown content with current locals dictionary using @<@…@>@ instead of {…}.
# Add Python code as a literal block
for x in ():
  1 / 0 / 0
# Interactive code
1 + 1
2
2 * 4 * 2
16
a, b = 1, 2
1, 2, 3
(1, 2, 3)
# Guarded error
1/0
ZeroDivisionError division by zero
[0;31m---------------------------------------------------------------------------[0m
[0;31mZeroDivisionError[0m Traceback (most recent call last)
[0;32m~/home/developpement/python/pyterate/examples/document-generator/full-test.py[0m in [0;36m<module>[0;34m[0m
[0;32m----> 1[0;31m [0;36m1[0m[0;34m/[0m[0;36m0[0m[0;34m[0m[0;34m[0m[0m
[0m
[0;31mZeroDivisionError[0m: division by zero
# Add a Python file as a literal block
#skip#

####################################################################################################

from PySpice.Spice.Netlist import SubCircuitFactory
from PySpice.Unit import *

####################################################################################################

class RingModulator(SubCircuitFactory):

    __name__ = 'RingModulator'
    __nodes__ = ('input_plus', 'input_minus',
                 'carrier_plus', 'carrier_minus',
                 'output_plus', 'output_minus')

    ##############################################

    def __init__(self,
                 outer_inductance,
                 inner_inductance,
                 coupling,
                 diode_model,
                ):

        super().__init__()

        input_inductor = self.L('input', 'input_plus', 'input_minus', outer_inductance)
        top_inductor = self.L('input_top', 'input_top', 'carrier_plus', inner_inductance)
        bottom_inductor = self.L('input_bottom', 'carrier_plus', 'input_bottom', inner_inductance)
        self.CoupledInductor('input_top', input_inductor.name, top_inductor.name, coupling)
        self.CoupledInductor('input_bottom', input_inductor.name, bottom_inductor.name, coupling)

        self.X('D1', diode_model, 'input_top', 'output_top')
        self.X('D2', diode_model, 'output_top', 'input_bottom')
        self.X('D3', diode_model, 'input_bottom', 'output_bottom')
        self.X('D4', diode_model, 'output_bottom', 'input_top')

        top_inductor = self.L('output_top', 'output_top', 'carrier_minus', inner_inductance)
        bottom_inductor = self.L('output_bottom', 'carrier_minus', 'output_bottom', inner_inductance)
        output_inductor = self.L('output', 'output_plus', 'output_minus', outer_inductance)
        self.CoupledInductor('output_top', output_inductor.name, top_inductor.name, coupling)
        self.CoupledInductor('output_bottom', output_inductor.name, bottom_inductor.name, coupling)
# Add the file content as literal block
* /home/gv/fabrice/developpement/PySpice/examples/spice-parser/kicad-pyspice-example/kicad-pyspice-example.cir

* EESchema Netlist Version 1.1 (Spice format) creation date: dim. 29 nov. 2015 18:04:33 CET

* To exclude a component from the Spice Netlist add [Spice_Netlist_Enabled] user FIELD set to: N
* To reorder the component spice node sequence add [Spice_Node_Sequence] user FIELD and define sequence: 2,1,0

* Sheet Name: /
X3  7 6 5 4 1 Opamp
X1  2 5 5 JackIn
X4  7 3 5 JackOut
R2  6 7 50K
R1  2 6 2K
R3  5 3 2K
X2  4 5 1 PowerIn

.end
# Insert an image

# Insert Circuit_macros diagram
# Insert Tikz figure
# An image node accept theses reST image parameters: align, scale, height, width

# Insert a generated figure
import numpy as np
import matplotlib.pyplot as plt
figure = plt.figure(1, (20, 10))
x = np.arange(1, 10, .1)
y = np.sin(x)
plt.plot(x, y)

# Insert a Matplotlib figure
# Insert a table
N = 2
x = np.arange(-N, N, 0.5)
y = np.arange(-N, N, 0.5)
xx, yy = np.meshgrid(x, y, sparse=True)
z = np.sin(xx**2 + yy**2) / (xx**2 + yy**2 + .1)
0.1 |
-0.0 |
-0.2 |
-0.2 |
-0.2 |
-0.2 |
-0.2 |
-0.0 |
-0.0 |
-0.2 |
-0.0 |
0.2 |
0.3 |
0.2 |
-0.0 |
-0.2 |
-0.2 |
-0.0 |
0.4 |
0.7 |
0.8 |
0.7 |
0.4 |
-0.0 |
-0.2 |
0.2 |
0.7 |
0.8 |
0.7 |
0.8 |
0.7 |
0.2 |
-0.2 |
0.3 |
0.8 |
0.7 |
0.0 |
0.7 |
0.8 |
0.3 |
-0.2 |
0.2 |
0.7 |
0.8 |
0.7 |
0.8 |
0.7 |
0.2 |
-0.2 |
-0.0 |
0.4 |
0.7 |
0.8 |
0.7 |
0.4 |
-0.0 |
-0.0 |
-0.2 |
-0.0 |
0.2 |
0.3 |
0.2 |
-0.0 |
-0.2 |
A |
B |
C |
D |
E |
F |
G |
H |
|---|---|---|---|---|---|---|---|
0.122 |
-0.005 |
-0.188 |
-0.206 |
-0.185 |
-0.206 |
-0.188 |
-0.005 |
-0.005 |
-0.213 |
-0.032 |
0.230 |
0.331 |
0.230 |
-0.032 |
-0.213 |
-0.188 |
-0.032 |
0.433 |
0.703 |
0.765 |
0.703 |
0.433 |
-0.032 |
-0.206 |
0.230 |
0.703 |
0.799 |
0.707 |
0.799 |
0.703 |
0.230 |
-0.185 |
0.331 |
0.765 |
0.707 |
0.000 |
0.707 |
0.765 |
0.331 |
-0.206 |
0.230 |
0.703 |
0.799 |
0.707 |
0.799 |
0.703 |
0.230 |
-0.188 |
-0.032 |
0.433 |
0.703 |
0.765 |
0.703 |
0.433 |
-0.032 |
-0.005 |
-0.213 |
-0.032 |
0.230 |
0.331 |
0.230 |
-0.032 |
-0.213 |
foo = 1